Medical Coder Salary in Illinois: $46,050 (2026)
Quick Answer:Across Illinois's 65 metropolitan areas, the average median medical coder pay sits at $46,050/year heading into 2026 — a figure projected from 2025 BLS OEWS wage data for SOC 29-2072. Because Illinois sits at BEA RPP 97.1 (3% below the U.S. baseline), that statewide median translates to roughly $47,425 in nationally-comparable purchasing power. Highest-paying metros: Naperville ($46,860), Chicago ($46,376), Elgin ($45,962).
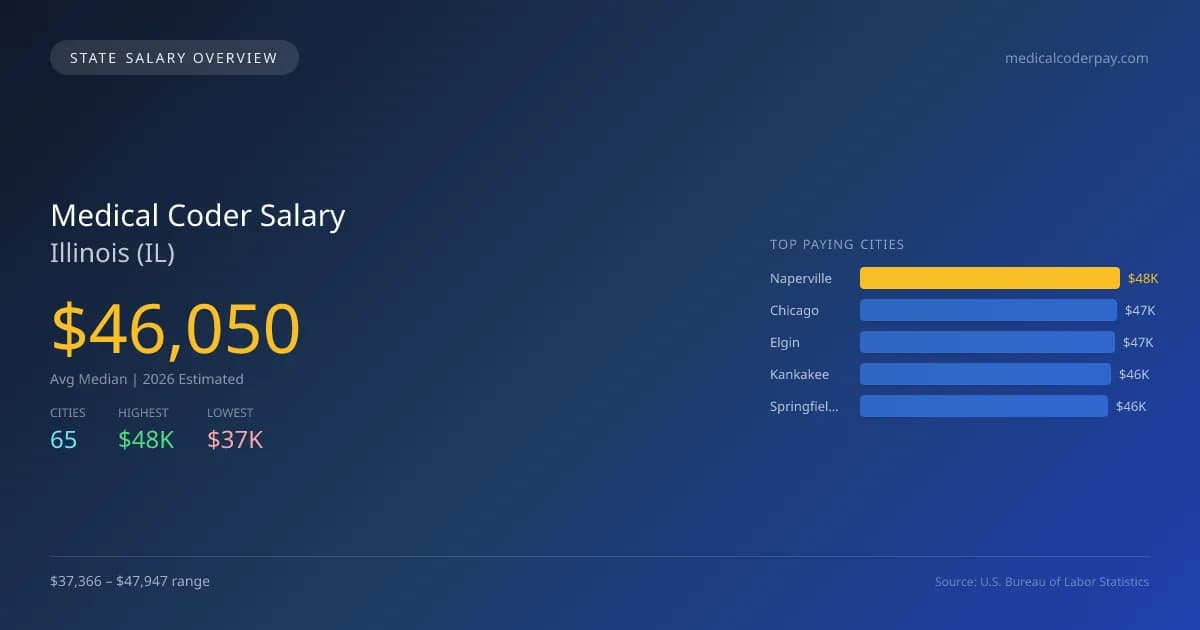
In Illinois, the average median salary for medical coders in 2026 is projected to be $46,050, which is 10.0% above the national median of $41,861. The highest paying city in the state is Naperville, where medical coders can expect to earn around $47,947, while Rock Island offers the lowest salaries at approximately $37,366. This $10,581 salary gap between the highest and lowest paying cities can be influenced by factors such as the cost of living, demand for healthcare services, and the concentration of medical facilities. Illinois has specific state licensing requirements and certain scope of practice laws that can affect job qualifications and responsibilities. The demand for medical coders in the state is driven by the ongoing need for accurate medical billing and coding due to an expanding healthcare industry. As of 2026, there are about 5,771 medical coders employed across the state, with a projected growth rate of 2.32% annually, indicating a steady job market outlook for this occupation. Major cities like Chicago, Elgin, Kankakee, and Springfield also offer salaries close to the state average, underscoring a solid demand for skilled medical coders throughout Illinois.
Illinois Medical Coder Salary Range
Overall salary range in Illinois: $26,591 (lowest entry-level) to $74,318 (highest top earner)
Illinois vs National Average
Illinois medical coders earn 10.01% more than the national median (+$4,189/year difference).
Illinois Medical Coder Salary Distribution (2026)
Medical Coder salaries in Illinois range from $33,115 (entry-level, 10th percentile) to $63,729 (top earners, 90th percentile), with a median of $46,050. The Illinois median is $4,189 above the US national median of $41,861. The average hourly rate is $22.14/hr. Approximately 5,771 medical coders are employed across 65 cities.
2021 BLS Actual
$46,416
2025 BLS Actual
$45,006
2026 Current Est.
$46,050
2021–2027 Growth
+1.5%
Salary Trajectory for Medical Coders in Illinois (2021–2027)
2021–2025: actual BLS OEWS data for this metro area. 2026+: CAGR 2.32% projection.
| Year | Annual Salary | Status |
|---|---|---|
| 2021 | $46,416 | Actual |
| 2022 | $48,339 | Actual |
| 2023 | $51,073 | Actual |
| 2024 | $49,398 | Actual |
| 2025 | $45,006 | Actual |
| 2026(current) | $46,050 | Estimated |
| 2027 | $47,119 | Projected |
Based on 5 years of BLS OEWS data for the Illinois metropolitan area, the median medical coder salary grew -3.0% from $46,416 (2021) to $45,006 (2025). At a 2.32% compound annual growth rate, salaries are projected to reach $47,119 by 2027 — a total increase of $703 (1.51%) from 2021.
Note: Historical values (2021–2025) are actual BLS OEWS figures for the Illinois metropolitan area, sourced from annual Occupational Employment and Wage Statistics surveys. 2026–2026 figures are current estimates, and 2027 values are projections, calculated using a 2.32% CAGR derived from 5-year BLS historical data. Actual salaries may vary based on employer, experience, certifications, and local market conditions.
Top 5 Highest Paying Cities in Illinois
Lowest Paying Cities in Illinois
| City | Median Salary |
|---|---|
| Rock Island | $37,366 |
| Urbana | $37,484 |
| Champaign | $37,621 |
| Moline | $37,955 |
| Carbondale | $38,309 |
Best Value Cities for Medical Coders in Illinois
When adjusted for local cost of living, these Illinois cities offer the most purchasing power for medical coders.
| City | Nominal Salary | CoL Index | Adjusted Salary |
|---|---|---|---|
| Naperville | $47,947 | 97.1 | $49,379 |
| Springfield | $45,676 | 92.745 | $49,249 |
| Elgin | $47,028 | 97.1 | $48,433 |
| Kankakee | $46,208 | 96.394 | $47,937 |
| Decatur | $40,985 | 88.422 | $46,352 |
Adjusted salary = nominal salary × (100 / CoL index). CoL index: 100 = national average. Lower index = lower cost of living.
Salary by Experience Level in Illinois
| Experience Level | Estimated Annual |
|---|---|
| Entry Level (0-2 years) | $33,115 |
| Mid Career (3-7 years) | $46,050 |
| Experienced (7+ years) | $63,729 |
Estimates based on BLS percentile data averaged across Illinois metro areas. Individual pay varies by employer, certifications, and specialization.
All 65 Cities in Illinois
More Illinois Salary Data
Compare Cities in Illinois
View all comparisons →Explore More Medical Coder Salary Data
Frequently Asked Questions
How much do medical coders make in Illinois in 2026?
What is the highest paying city for medical coders in Illinois?
How does Illinois medical coder pay compare to the national average?
What is the entry-level medical coder salary in Illinois?
How many medical coders are employed in Illinois?
Which Illinois city offers the best value for medical coders?
Written by Aisha Patel, RHIT, CPC
Career Analyst
Aisha has over 10 years of experience in medical coding. She specializes in inpatient coding at acute care facilities. Aisha works closely with healthcare providers to ensure accurate coding practices.
Methodology & Data Source
Statewide salary figures on this page are 2026 projections based on the Bureau of Labor Statistics Occupational Employment and Wage Statistics (OEWS) survey, May 2026 release. A 2.32% compound annual growth rate (CAGR), derived from 6-year national BLS wage trends, was applied to each metro area's reported salary to estimate current 2026 medical coder compensation across Illinois. State averages are employment-weighted across 65 metro areas — larger metro areas with more medical coderscontribute proportionally more to the average, producing figures that better reflect typical compensation. Individual pay varies by city, employer, certifications, and experience.
Data Sources & Methodology
Source: BLS, OEWS, 5-year dataset (–). Per-city data from annual BLS metropolitan area surveys.
2026 figures are projected from 2025 BLS data using a compound annual growth rate (CAGR) of 2.32%, derived from historical BLS wage trends for medical coders (SOC 29-2072).
Compiled and verified by Aisha Patel, RHIT, CPC, a licensed medical coder with 10+ years of clinical experience. · View source data at BLS.gov