Medical Coder Salary in Nevada: $40,471 (2026)
Quick Answer:Across Nevada's 9 metropolitan areas, the average median medical coder pay sits at $40,471/year heading into 2026 — a figure projected from 2025 BLS OEWS wage data for SOC 29-2072. Because Nevada sits at BEA RPP 98.3 (2% below the U.S. baseline), that statewide median translates to roughly $41,171 in nationally-comparable purchasing power. Highest-paying metros: Carson City ($46,160), Reno ($40,520), Las Vegas ($39,272).
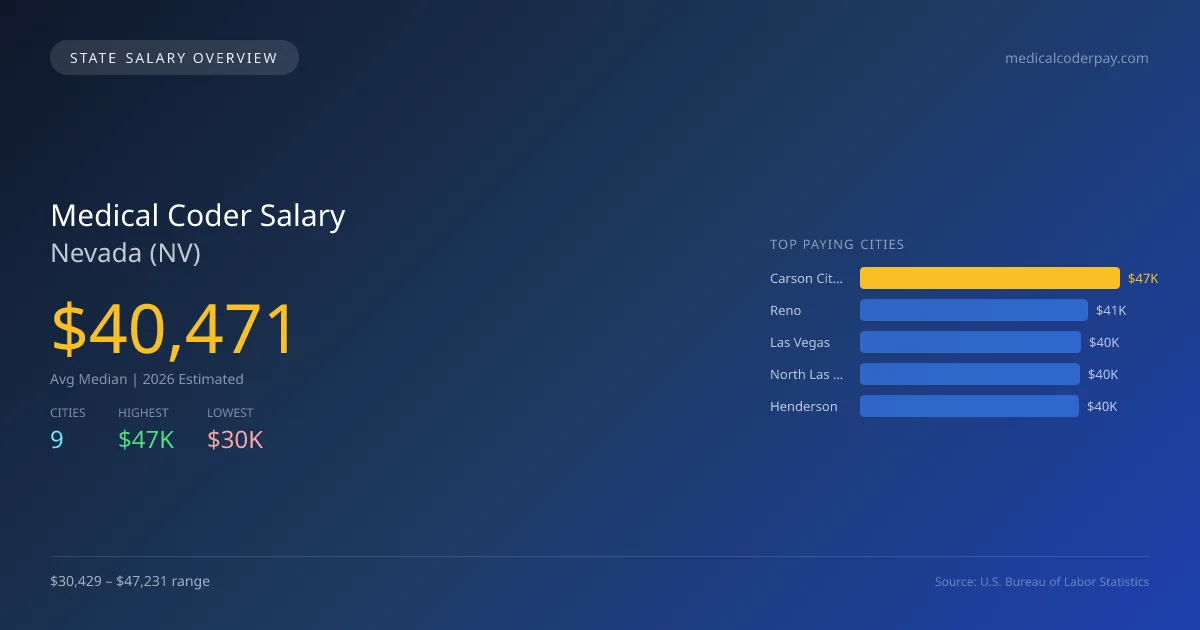
In Nevada, medical coder salaries show a slight lag compared to national averages. The projected average median salary for this role in 2026 is $40,471, which falls short of the national median of $41,861 by 3.3%. The disparity within the state is evident, with Carson City offering the highest salary at $47,231, while Fernley reports the lowest at $30,429. This gap of $16,802 can be attributed to various factors, including cost of living differences, local demand for healthcare services, and the presence of larger healthcare facilities in urban areas compared to smaller towns. In Nevada, medical coders are typically not required to hold state licenses, but having certifications such as CPC or CCS can enhance job prospects. With a projected annual growth rate of 2.32%, the demand for medical coders is expected to rise, driven by the expansion of healthcare services and the need for accurate medical billing and coding. As of 2026, there are an estimated 2,361 medical coders employed across the state, with significant salaries in major metropolitan areas. Notable salaries include Reno at $41,460, Las Vegas at $40,183, North Las Vegas at $40,014, and Henderson at $39,809, highlighting the varied earning potential based on location.
Nevada Medical Coder Salary Range
Overall salary range in Nevada: $22,319 (lowest entry-level) to $69,938 (highest top earner)
Nevada vs National Average
Nevada medical coders earn 3.32% less than the national median ($-1,390/year difference).
Nevada Medical Coder Salary Distribution (2026)
Medical Coder salaries in Nevada range from $30,052 (entry-level, 10th percentile) to $65,436 (top earners, 90th percentile), with a median of $40,471. The Nevada median is $1,390 below the US national median of $41,861. The average hourly rate is $19.46/hr. Approximately 2,361 medical coders are employed across 9 cities.
2021 BLS Actual
$37,790
2025 BLS Actual
$39,553
2026 Current Est.
$40,471
2021–2027 Growth
+9.6%
Salary Trajectory for Medical Coders in Nevada (2021–2027)
2021–2025: actual BLS OEWS data for this metro area. 2026+: CAGR 2.32% projection.
| Year | Annual Salary | Status |
|---|---|---|
| 2021 | $37,790 | Actual |
| 2022 | $38,610 | Actual |
| 2023 | $44,574 | Actual |
| 2024 | $64,082 | Actual |
| 2025 | $39,553 | Actual |
| 2026(current) | $40,471 | Estimated |
| 2027 | $41,410 | Projected |
Based on 5 years of BLS OEWS data for the Nevada metropolitan area, the median medical coder salary grew 4.7% from $37,790 (2021) to $39,553 (2025). At a 2.32% compound annual growth rate, salaries are projected to reach $41,410 by 2027 — a total increase of $3,620 (9.58%) from 2021.
Note: Historical values (2021–2025) are actual BLS OEWS figures for the Nevada metropolitan area, sourced from annual Occupational Employment and Wage Statistics surveys. 2026–2026 figures are current estimates, and 2027 values are projections, calculated using a 2.32% CAGR derived from 5-year BLS historical data. Actual salaries may vary based on employer, experience, certifications, and local market conditions.
Top 5 Highest Paying Cities in Nevada
Lowest Paying Cities in Nevada
Best Value Cities for Medical Coders in Nevada
When adjusted for local cost of living, these Nevada cities offer the most purchasing power for medical coders.
| City | Nominal Salary | CoL Index | Adjusted Salary |
|---|---|---|---|
| Carson City | $47,231 | 98.13 | $48,131 |
| Reno | $41,460 | 101.014 | $41,044 |
| North Las Vegas | $40,014 | 98.3 | $40,706 |
| Henderson | $39,809 | 98.3 | $40,497 |
| Las Vegas | $40,183 | 100.215 | $40,097 |
Adjusted salary = nominal salary × (100 / CoL index). CoL index: 100 = national average. Lower index = lower cost of living.
Salary by Experience Level in Nevada
| Experience Level | Estimated Annual |
|---|---|
| Entry Level (0-2 years) | $30,052 |
| Mid Career (3-7 years) | $40,471 |
| Experienced (7+ years) | $65,436 |
Estimates based on BLS percentile data averaged across Nevada metro areas. Individual pay varies by employer, certifications, and specialization.
All 9 Cities in Nevada
| # | City | Median Salary |
|---|---|---|
| 1 | Carson City | $47,231 |
| 2 | Reno | $41,460 |
| 3 | Las Vegas | $40,183 |
| 4 | North Las Vegas | $40,014 |
| 5 | Henderson | $39,809 |
| 6 | Sparks | $33,214 |
| 7 | Mesquite | $30,959 |
| 8 | Elko | $30,802 |
| 9 | Fernley | $30,429 |
More Nevada Salary Data
Senior / Experienced
Top earner salaries for experienced medical coders.
Compare Cities in Nevada
View all comparisons →Explore More Medical Coder Salary Data
Frequently Asked Questions
How much do medical coders make in Nevada in 2026?
What is the highest paying city for medical coders in Nevada?
How does Nevada medical coder pay compare to the national average?
What is the entry-level medical coder salary in Nevada?
How many medical coders are employed in Nevada?
Which Nevada city offers the best value for medical coders?
Written by Aisha Patel, RHIT, CPC
Career Analyst
Aisha has over 10 years of experience in medical coding. She specializes in inpatient coding at acute care facilities. Aisha works closely with healthcare providers to ensure accurate coding practices.
Methodology & Data Source
Statewide salary figures on this page are 2026 projections based on the Bureau of Labor Statistics Occupational Employment and Wage Statistics (OEWS) survey, May 2026 release. A 2.32% compound annual growth rate (CAGR), derived from 6-year national BLS wage trends, was applied to each metro area's reported salary to estimate current 2026 medical coder compensation across Nevada. State averages are employment-weighted across 9 metro areas — larger metro areas with more medical coderscontribute proportionally more to the average, producing figures that better reflect typical compensation. Individual pay varies by city, employer, certifications, and experience.
Data Sources & Methodology
Source: BLS, OEWS, 5-year dataset (–). Per-city data from annual BLS metropolitan area surveys.
2026 figures are projected from 2025 BLS data using a compound annual growth rate (CAGR) of 2.32%, derived from historical BLS wage trends for medical coders (SOC 29-2072).
Compiled and verified by Aisha Patel, RHIT, CPC, a licensed medical coder with 10+ years of clinical experience. · View source data at BLS.gov