Medical Coder Salary in Oregon: $48,591 (2026)
Quick Answer:Across Oregon's 36 metropolitan areas, the average median medical coder pay sits at $48,591/year heading into 2026 — a figure projected from 2025 BLS OEWS wage data for SOC 29-2072. Because Oregon sits at BEA RPP 102.6 (3% above the U.S. baseline), that statewide median translates to roughly $47,360 in nationally-comparable purchasing power. Highest-paying metros: Corvallis ($51,560), Hillsboro ($50,639), Bend ($50,384).
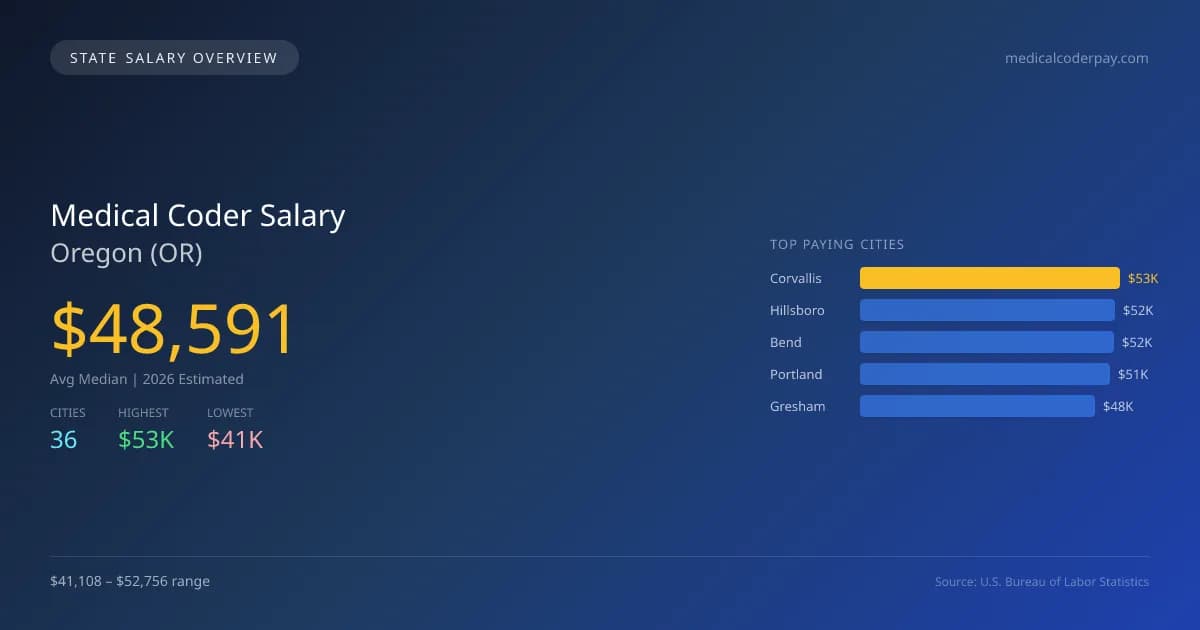
In 2026, medical coders in Oregon can expect an average median salary of $48,591, which is 16.1% higher than the national median of $41,861. This salary discrepancy is particularly notable when comparing cities within the state; Corvallis leads with an average salary of $52,756, while Medford offers the lowest at $41,108, reflecting a difference of $11,648. This gap is influenced by various factors, including the cost of living, demand for coding professionals in specific areas, and the presence of healthcare facilities. Oregon's licensing requirements and scope of practice laws may also shape salary expectations and job opportunities. A steady growth rate of 2.32% in the employment of medical coders suggests a positive job market outlook, translating to a demand for skilled professionals in both urban and rural settings. The top projected paying cities include Hillsboro at $51,814, Bend at $51,553, and Portland at $50,661, indicating a concentration of higher-paying opportunities in specific regions. With a total of 2,642 medical coders employed, Oregon's job market reflects the healthcare sector's ongoing need for accurate coding services, ensuring a favorable environment for those entering the field.
Oregon Medical Coder Salary Range
Overall salary range in Oregon: $29,485 (lowest entry-level) to $80,311 (highest top earner)
Oregon vs National Average
Oregon medical coders earn 16.08% more than the national median (+$6,730/year difference).
Oregon Medical Coder Salary Distribution (2026)
Medical Coder salaries in Oregon range from $36,717 (entry-level, 10th percentile) to $67,506 (top earners, 90th percentile), with a median of $48,591. The Oregon median is $6,730 above the US national median of $41,861. The average hourly rate is $23.36/hr. Approximately 2,642 medical coders are employed across 36 cities.
2021 BLS Actual
$50,947
2025 BLS Actual
$47,489
2026 Current Est.
$48,591
2021–2027 Growth
+-2.4%
Salary Trajectory for Medical Coders in Oregon (2021–2027)
2021–2025: actual BLS OEWS data for this metro area. 2026+: CAGR 2.32% projection.
| Year | Annual Salary | Status |
|---|---|---|
| 2021 | $50,947 | Actual |
| 2022 | $51,959 | Actual |
| 2023 | $55,504 | Actual |
| 2024 | $57,631 | Actual |
| 2025 | $47,489 | Actual |
| 2026(current) | $48,591 | Estimated |
| 2027 | $49,718 | Projected |
Based on 5 years of BLS OEWS data for the Oregon metropolitan area, the median medical coder salary grew -6.8% from $50,947 (2021) to $47,489 (2025). At a 2.32% compound annual growth rate, salaries are projected to reach $49,718 by 2027 — a total increase of $-1,229 (-2.41%) from 2021.
Note: Historical values (2021–2025) are actual BLS OEWS figures for the Oregon metropolitan area, sourced from annual Occupational Employment and Wage Statistics surveys. 2026–2026 figures are current estimates, and 2027 values are projections, calculated using a 2.32% CAGR derived from 5-year BLS historical data. Actual salaries may vary based on employer, experience, certifications, and local market conditions.
Top 5 Highest Paying Cities in Oregon
Lowest Paying Cities in Oregon
| City | Median Salary |
|---|---|
| Medford | $41,108 |
| Milwaukie | $42,888 |
| Klamath Falls | $42,991 |
| The Dalles | $43,251 |
| Springfield | $43,429 |
Best Value Cities for Medical Coders in Oregon
When adjusted for local cost of living, these Oregon cities offer the most purchasing power for medical coders.
| City | Nominal Salary | CoL Index | Adjusted Salary |
|---|---|---|---|
| Corvallis | $52,756 | 104.017 | $50,719 |
| Hillsboro | $51,814 | 102.6 | $50,501 |
| Bend | $51,553 | 103.607 | $49,758 |
| Portland | $50,661 | 105.421 | $48,056 |
| Gresham | $47,750 | 102.6 | $46,540 |
Adjusted salary = nominal salary × (100 / CoL index). CoL index: 100 = national average. Lower index = lower cost of living.
Salary by Experience Level in Oregon
| Experience Level | Estimated Annual |
|---|---|
| Entry Level (0-2 years) | $36,717 |
| Mid Career (3-7 years) | $48,591 |
| Experienced (7+ years) | $67,506 |
Estimates based on BLS percentile data averaged across Oregon metro areas. Individual pay varies by employer, certifications, and specialization.
All 36 Cities in Oregon
| # | City | Median Salary |
|---|---|---|
| 1 | Corvallis | $52,756 |
| 2 | Hillsboro | $51,814 |
| 3 | Bend | $51,553 |
| 4 | Portland | $50,661 |
| 5 | Gresham | $47,750 |
| 6 | Albany | $47,092 |
| 7 | Salem | $46,666 |
| 8 | Beaverton | $46,390 |
| 9 | McMinnville | $46,264 |
| 10 | Oregon City | $46,210 |
| 11 | Woodburn | $45,902 |
| 12 | Lake Oswego | $45,681 |
| 13 | Forest Grove | $45,561 |
| 14 | Tigard | $45,370 |
| 15 | Redmond | $45,354 |
| 16 | West Linn | $45,224 |
| 17 | Grants Pass | $44,996 |
| 18 | Tualatin | $44,834 |
| 19 | Pendleton | $44,829 |
| 20 | Wilsonville | $44,765 |
| 21 | Happy Valley | $44,380 |
| 22 | Hermiston | $44,257 |
| 23 | Central Point | $44,236 |
| 24 | Ashland | $44,233 |
| 25 | Keizer | $44,222 |
| 26 | Sherwood | $44,219 |
| 27 | Coos Bay | $44,145 |
| 28 | Eugene | $43,998 |
| 29 | Roseburg | $43,983 |
| 30 | Canby | $43,959 |
| 31 | Newberg | $43,717 |
| 32 | Springfield | $43,429 |
| 33 | The Dalles | $43,251 |
| 34 | Klamath Falls | $42,991 |
| 35 | Milwaukie | $42,888 |
| 36 | Medford | $41,108 |
More Oregon Salary Data
Explore More Medical Coder Salary Data
Frequently Asked Questions
How much do medical coders make in Oregon in 2026?
What is the highest paying city for medical coders in Oregon?
How does Oregon medical coder pay compare to the national average?
What is the entry-level medical coder salary in Oregon?
How many medical coders are employed in Oregon?
Which Oregon city offers the best value for medical coders?
Written by Aisha Patel, RHIT, CPC
Career Analyst
Aisha has over 10 years of experience in medical coding. She specializes in inpatient coding at acute care facilities. Aisha works closely with healthcare providers to ensure accurate coding practices.
Methodology & Data Source
Statewide salary figures on this page are 2026 projections based on the Bureau of Labor Statistics Occupational Employment and Wage Statistics (OEWS) survey, May 2026 release. A 2.32% compound annual growth rate (CAGR), derived from 6-year national BLS wage trends, was applied to each metro area's reported salary to estimate current 2026 medical coder compensation across Oregon. State averages are employment-weighted across 36 metro areas — larger metro areas with more medical coderscontribute proportionally more to the average, producing figures that better reflect typical compensation. Individual pay varies by city, employer, certifications, and experience.
Data Sources & Methodology
Source: BLS, OEWS, 5-year dataset (–). Per-city data from annual BLS metropolitan area surveys.
2026 figures are projected from 2025 BLS data using a compound annual growth rate (CAGR) of 2.32%, derived from historical BLS wage trends for medical coders (SOC 29-2072).
Compiled and verified by Aisha Patel, RHIT, CPC, a licensed medical coder with 10+ years of clinical experience. · View source data at BLS.gov